Wind Rose: The Beginners guide
Wind Rose is a representation of data in such a way that it helps us to understand wind direction, speed and frequency in a circular format.
Wind energy is considered as a renewable source of energy which can be used to operate windmills and wind turbines at locations where the intensity and speed of wind energy are strong enough for them to function properly.
Windmills are used at industry and household level to conserve power, whereas wind turbines are used in wind farms and wind energy industries. The Danish wind industry association mentioned that determining wind direction helps in setting up wind turbines and windmills in the direction of the wind and to a suited elevation.
The average of annual measurements is taken for placing in the locations where maximum wind speed can be received. Thus, it is important to determine the necessary wind data of a target area to estimate a suitable location for installing windmills and wind turbines.
This can be achieved by drawing or constructing a wind rose diagram.
What is Wind Rose?
In 2010, Fondriest staff defined wind speed as the speed of air blowing over a particular location in a specified time, and wind direction as an indicator of the direction from where the wind begins to generate.
Windrose Diagram
A windrose diagram is a graphical tool used to visualize the distribution and frequency of wind directions at a specific location over a given period of time. This diagram consists of a circular plot divided into segments that represent different wind directions (e.g., north, south, east, west) around the compass.
The length of each segment corresponds to the proportion of time the wind blows from that direction, while color shading or concentric circles may indicate wind speed ranges.
Windrose diagrams are commonly used in meteorology, environmental studies, and urban planning to understand prevailing wind patterns, which are crucial for assessing factors such as air quality, dispersion of pollutants, and potential impacts on structures and landscapes.
How to read Wind Rose Diagram?
Wind speed and direction are both important for evaluating weather conditions and climate and predicting them. Moreover, these parameters influence processes such as evaporation rates, surface water mixing; which further affect the water quality and the water level.
National water and climate centre (NCRS), USA explained that a wind rose enables the understanding of the direction and distribution of wind speed at a specific location.
A wind rose is represented as a series of concentric circles with spokes where the length of each spoke is linked with the frequency of wind blowing from a certain direction indicated by that particular spoke.
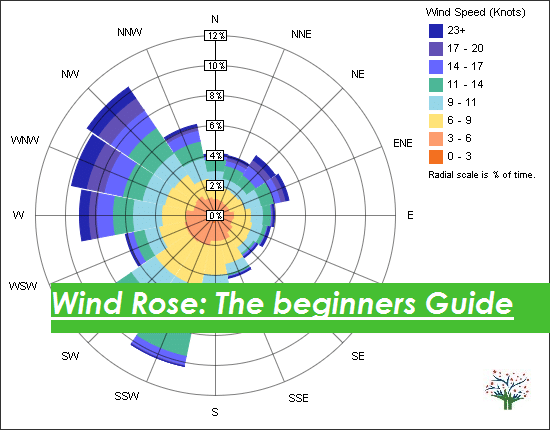
NCRS also illustrated that the concentric circles highlight different frequencies starting from zero at the centre and increasing to greater frequencies moving outwards from the centre. According to the National forest avalanche centre of the USA, the different colours of the spokes indicate the different wind speeds
Some argue that wind roses only provide relative wind direction and not the actual wind direction or actual wind
speed. For example, the Danish wind industry association agreed that wind rose is considered to provide relative distribution of wind direction.
Munn (1969) declared that wind direction determines the quality of air and pollution, and wind roses are helpful for detecting the pollution in air, and also explained that winds are lighter during the night than during the day and in summer as compared to winter.
These points must be kept in mind while assessing air pollution using wind roses.
Read More about Ventilation Survey
How to make Wind Rose diagram?
Some websites such as the state climate office of North Carolina, allow creation of wind roses on their websites by entering wind data of the target location. Alternatively, wind rose diagrams can be created manually or by using Microsoft Excel or by downloading a suitable software designed to generate a wind rose diagram.
Australian Bureau of Meteorology reported that wind roses provide information on the occurrence of winds at a location, explaining their strength, direction and frequency.
Danish wind industry association declared that wind roses vary with location however, they may show similar readings within a locality; therefore average values are taken.
Are there any drawbacks of a wind rose?
Slade (1968), as mentioned in Graedel (1976), the considered wind rose as a polar plot of wind speed acting as a function of wind direction. Wind data can be represented statistically as boxplots.
Graedel (1976) declared that wind rose diagrams may be difficult or complex to construct and some may prefer wind boxplots instead.
A wind boxplot illustrates wind direction and speed in a better way than wind rose and it can work in association with computer graphics and statistical tools.
Wind Rose Compass
A wind rose compass, also known simply as a wind compass or wind rose, is a graphical representation used to display the distribution of wind directions and frequencies at a particular location. It takes the form of a circular diagram resembling a compass rose, which is a traditional navigational tool used to indicate the cardinal directions.
In a wind rose compass, the circular plot is divided into segments representing different wind directions, with the length of each segment indicating the frequency or proportion of time that the wind blows from that direction.
This visualization tool is commonly used in fields like meteorology, climatology, and environmental studies to understand prevailing wind patterns and their implications for various applications such as air quality assessment, building orientation, and landscape planning.
Wind Rose Generator by Location
A wind rose generator by location is a specialized tool that provides a comprehensive visualization of wind patterns at a specific geographical point. It takes meteorological data, such as wind direction and speed, and creates a wind rose chart, displaying the frequency and intensity of winds from different compass directions.
This valuable tool finds applications in various industries, including renewable energy, urban planning, and environmental studies, enabling professionals to make informed decisions based on the prevailing wind conditions at a particular site.
With its ability to present complex wind data in an easy-to-understand format, the wind rose generator plays a crucial role in optimizing the design and placement of structures, as well as in assessing the potential of wind resources for sustainable energy projects.
Wind Rose Diagram Generator Online
These are some of the popular websites which generate Win Rose Diagram online:
Some of them are free. Enjoy! 🙂
- Wind Rose Generator: https://www.windrose.fr/
- Wind Rose Tool: https://windrosetool.com/
- Earth Analytics Wind Rose: https://www.earthdatascience.org/workshops/gis-open-source-python/wind-rose/
- Plotly Wind Rose: https://plotly.com/python/wind-rose-charts/
- Wind Rose Chart Generator: https://windrosechart.com/
- Wind Rose Creator: https://windrosecreator.com/
- Wind Rose Diagram Generator (meteomatics): https://www.meteomatics.com/en/windrose/
- Wind Rose Visualization (Wind Data Viz): https://winddataviz.netlify.app/
- Ventsim Wind Rose Diagram: https://www.ventsim.com/wind-rose-diagram/
Wind Rose analysis & Interpretation
Despite the drawback mentioned above, wind roses are widely used in industries for environmental monitoring and for keeping an eye on the air pollution levels. With the different web applications for drawing wind rose diagrams, some may not find it complex to use and construct.
Munn (1969) explained that one of the main uses of wind rose diagrams is to interpret the air quality associated with each wind direction drawn.
Wind roses also find their use in environmental monitoring industries where they can be used to monitor the wind patterns and predict harsh climatic conditions such as tornadoes or hurricanes, as well as to monitor the air quality and water levels.
Similarly, wind roses are used by meteorology department to monitor the climate and may be used in airports for guiding flights to take off in the right direction where there will be minimum interference by wind.
Share this Article with your Family and Friends!
To find a wind rose for a specific location, you can use online resources or specialized software that offer wind data analysis tools. Input the latitude and longitude coordinates or the name of the location, and the tool will generate a wind rose chart displaying the frequency and direction of winds at that particular site.
To obtain windrose data, you can either collect it directly from on-site weather monitoring stations or access it from reliable meteorological databases and services. Windrose data typically includes information on wind direction, wind speed, and the frequency of wind occurrences, essential for various applications like renewable energy planning, environmental studies, and urban design.
The wind rose of an area is a graphical representation that displays the frequency and direction of winds blowing from different compass points over a specific period. It provides a clear visual summary of wind patterns, indicating prevailing wind directions and their relative frequencies, making it a valuable tool for analyzing and understanding the wind climate of a particular location.
To find prevailing winds in your area, you can refer to historical weather data from local weather stations or online weather databases. Look for information on wind direction and frequency over an extended period, and identify the most common wind direction to determine the prevailing winds in your location.
A wind rose is a type of polar diagram, also known as a circular diagram, that is used to display the distribution of wind directions and frequencies at a specific location.
It is typically represented as a circular plot divided into segments, each corresponding to a different wind direction, and the length of the segments or the shading represents the frequency or intensity of the winds blowing from those directions.
The circular layout of the wind rose allows for a clear visualization of how wind patterns vary throughout the year or a specific period.