Ambient Air Quality Standards
Ambient air quality standards are the legal limits of air pollutants during given period of time defined by authority. They are allowable level of pollutants in environment to the population or ecological system.
National Ambient air quality standards (NAAQS) for ambient air quality monitoring (NAAQM) established by Central pollution Control Board (CPCB) of India in November 2009 for the ambient air quality of entire country. Addition to this CPCB has notified the quality of air in its notification.
Categories for Ambient Air Quality Standards
For this Purpose Entire country was divided into three categories
- Industrial Areas
- Residential and Rural Area
- Sensitive Area (Schools, Hospitals etc.)
Main objective of to define Ambient air quality standards is to protect Human health. For normal populations as well as children, elder adult, Individuals suffering from respiratory diseases like asthma etc. Also to provide uniform quality for all, irrespective of land use purpose, across all country.
Standards for Major Four Parameters like SPM, SO2, CO and NOx only are defined. Ambient air quality standards become strict as we go from category 1 to 3.
There are total 12 parameters identified by CPCB affect human health, which are to be measured across all country by same method to keep uniformity.
Ambient Air Quality Standards
Below are the National ambient Air Quality Standards Chart dated 16.11.2009
| POLLUTANTS | Time Weighted Avg | Concentration of Ambient Air | |||
| Industrial Area | Residential Rural and other area | Sensitive area | Method of Measurement | ||
| Sulphur Dioxide (SO2) | Annual Average | 80 gm/m3 | 60 gm/m3 | 15 gm/m3 | Improved west and Gacke Method |
| 24 hrs | 120 gm/m3 | 80 gm/m3 | 30 gm/m3 | Ultraviolet fluorescence | |
| Oxides of Nitrogen (NO2) | Annual Average | 80 gm/m3 | 60 gm/m3 | 15 gm/m3 | Jacab Hochheister modified (Na-Arsentire method |
| 24 hrs | 120 gm/m3 | 80 gm/m3 | 30 gm/m3 | Gas Phase Chemilumine Scene | |
| Suspended Particulate Matter (SPM) | Annual Average | 360 gm/m3 | 140 gm/m3 | 70 gm/m3 | High Volume sampling (average flow rate not less than 1.1 m3/minute) |
| 24 hrs | 500 gm/m3 | 200 gm/m3 | 100 gm/m3 | ||
| Respirable Particulate Matter (size < 10 m) RPM | Annual Average | 120 gm/m3 | 60 gm/m3 | 50 gm/m3 | Respirable particulate matter sampler |
| 24 hrs | 150 gm/m3 | 100 gm/m3 | 75 gm/m3 | ||
| Lead as Pb | Annual Average | 1.0 gm/m3 | 0.75 gm/m3 | 0.50 gm/m3 | AAS method after sampling using EPM 2000 or equivalent filter paper |
| 24 hrs | 1.5 gm/m3 | 1.0 gm/m3 | 0.75 gm/m3 | ||
| Carbon Monoxide | 8 hrs | 5.0mgm/m3 | 2.0mgm/m3 | 1.0mgm/m3 | Non disbersive infrared spectroscopy |
| 1 hour | 10.0mgm/m3 | 4.0mgm/m3 | 2.0mgm/m3 | ||
National Ambient Air Quality Standards Chart (NAAQS) (Image)
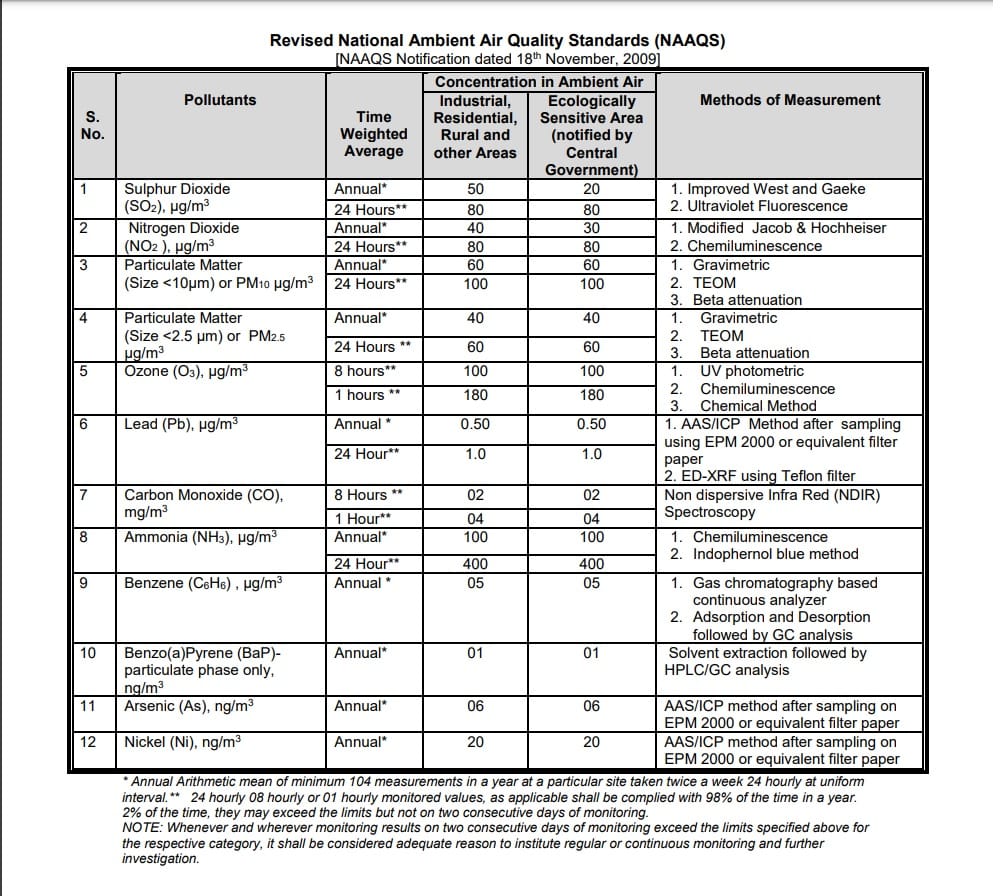
Annual Average means arithmetic mean for at least 104 readings in a year twice a week 24 hourly at uniform level
24 Hrs Average means 24 hourly, 8 hourly or 1 hourly ambient air quality monitoring values, as applicable, shall be complied with 98% of time. For remaining 2% days it can exceed but not on two consecutive days.
If ambient air quality monitoring results on two consecutive days of monitoring exceeds limits specified above for mentioned category, then that company should carry out regular/non-stop monitoring till further notice. Government Publish these results via newspapers TV or radio in regular intervals for major cities. For layman’s understanding there are some changes while showing it to them. They convert it into Air Quality index. it is just a ratio of actual pollutants levels present to permitted limits by pollution control board.
Read Here
Ambient Air Quality is Part of Environmental Monitoring.
Thanks for sharing this article. Here is some information about UV Water Analyzer offers an affordable and accurate solution for real-time UV or UVT monitoring.