Skip to content
Skip to content
Welcome to Perfect Pollucon Services Office Hours: 10:00am-7:00pm
Perfect Pollucon Services

Perfect Pollucon Services

Environmental Consultant & Laboratory

Call Us 9967436537
Mail Us [email protected]
Maharashtra, India 3 Krishna Koyna B, Majiwada, Thane W
  • Home
  • Monitoring Services
    • Ambient Air Quality Monitoring & Testing
    • Indoor Air Quality Monitoring & Testing
    • Air Quality Monitoring & Testing
    • Stack Emission Monitoring & Testing
    • Noise Level Monitoring & Testing
    • Food Testing Laboratory Services
    • Fugitive Emission Monitoring & Testing
    • Soil Testing & Investigation Laboratory
    • Drinking Water Quality Testing & Analysis Laboratory
    • Corrosion Testing Services
    • Illumination Survey / Lux Monitoring
    • Ventilation Survey
  • Consultancy Services
    • Environmental Impact Assessment
    • Environmental Statement Form V
    • MPCB Consent to Establish, Operate and Renewal
    • Operation and maintenance of Effluent Treatment Plant
    • Effluent Treatment Plant Design
    • Six Monthly EC Compliance Report
    • Self Audit Report MPCB
    • Environmental Compliance
  • Industries
    • Pharmaceutical Industries
    • Chemical and Petrochemical Industry
    • Construction & Real Estate
    • Oil and Gas Or Petroleum Industry
    • Manufacturing / Production Industry
    • Corrosion Control at Data Center / IT Industry
    • Mining and Mineral Extraction
    • Food & Cold Storage Industry
    • Supply Chain & Warehouses
    • Data Centres
    • Railways & Metro Projects
    • Hospitality & Tourism
    • Retail and Shopping Malls
  • Blog
  • Tools
    • Air Monitoring Calculators
    • Stack Monitoring Calculators
    • Noise Monitoring Calculators
    • Carbon & Energy Footprint Calculators
    • Lux & Illuminance Calculators
    • ETP & STP Calculators for Form-V
    • ETP Design Calculators
  • About Us
    • Vision
    • Why We Built EHSSaral?
    • Our Work and Clients
    • Case Studies
    • Testimonials & Leave Us a Review
    • Trusted Partners
    • Careers
    • Guest Posting – Write for Us
    • Press Release
    • Our Features
  • Contact Us
REQUEST A QUOTE
Sources of Air Pollutants
Tanaji Gajare

Sources of Air Pollutants

🌱 Last updated: October 11, 2025

Measurement of air pollutants is major step towards controlling them. Sources of Air pollutants can be natural or may be the results of activities of human like vehicles etc. Also air pollutants can be categorised as primary of secondary pollutants. In based on sources of air pollutants they can be differentiated like stationary or mobile sources.

Government has notified to all industries their emission limits and every manufacturing industry has to obey those rules so that we all can contribute to reduce pollution, also they notify us air pollution levels for every city in simple numbers through media like newspapers, televisions and radio etc. it is called as air quality index.

Read more why there is need to calculate air quality index?

Which Sources Contribute Most to Air Pollution in Indian Cities?

Contributions vary by city and season, but across major Indian urban centers a typical split looks like this. Use this as a directional guide; local studies often shift these percentages.

Source CategoryTypical Contribution RangeNotes (Hyperlocal Factors)
Transport (PM/NOx from vehicles)20–40%Higher near corridors/junctions; diesel share & congestion are key drivers.
Industries & Power (SO₂, NOx, PM)20–35%Depends on fuel type, stack controls, and proximity to industrial clusters.
Construction & Road Dust15–30%Peaks during dry months; poor dust suppression increases impact.
Biomass & Waste Burning10–25%Includes stubble burning episodes and open waste burning in peri-urban areas.
Domestic Fuels (LPG/wood/coal)5–15%Indoor→outdoor leakage; higher in low-ventilation, solid-fuel households.
Natural (dust storms, wildfires, volcanoes)0–10%Seasonal intrusions (e.g., dust storms) can cause short spikes.
Delhi NCR: Transport + stubble episodes dominate Oct–Nov; winter inversion worsens PM2.5.
Mumbai–Thane: Transport, construction dust, port/industrial activities near hot-spots.
Punjab–Haryana: Seasonal stubble burning lifts regional PM; local transport adds baseline.
Coal belts/Power hubs: Stack emissions key; FGD/ESP efficacy drives outcomes.

Sources: CPCB • WHO • PPS field studies.

Stack Emission Monitoring • Ambient Air Quality Monitoring • Indoor Air Quality Monitoring

Indoor Air Pollution (The Invisible Half)

Indians spend 80–90% of time indoors; yet indoor sources are often missed. The following everyday activities can drive PM2.5, VOCs and CO exposure at home and at work.

Cooking Fuels & Smoke
Solid fuels, poor chimneys & low ventilation elevate PM2.5 and CO. Fix: LPG/PNG, working chimney, cross-ventilation.
Cleaning & Fragrances
Aerosols, floor cleaners, incense & coils release VOCs. Fix: Low-VOCs, limit incense/coil use, ventilate after cleaning.
Mold & Dampness
Triggers allergies/asthma. Fix: Dehumidify, repair leaks, sunlight exposure.
Tobacco & E-cig Aerosols
Fine particles & toxins linger indoors. Fix: Create smoke-free homes/offices.
PollutantTypical Indoor SourcePractical Control
PM2.5Cooking smoke, candles/incense, dustHEPA purifier, chimney, wet-mopping, ventilation
VOCsCleaners, paints, air freshenersLow-VOC products, purge ventilation after use
COPoorly vented stoves, generatorsProper venting, avoid indoor gensets, CO alarms
Mold SporesDamp rooms & leaksFix leaks, dehumidifier, sunlight

Best Air Purifiers in India (Guide to Avoid Mistakes before buying)

Classification and Sources of Air Pollutants

Air pollutants can be classified as follow:

Natural Pollutants

There are several natural pollutant pollute air such as Natural fog, particles of volcanic eruption, Pollen grains, bacteria etc. amongst of them pollen grains are very important because their size range can vary from 5 µ to 100 µ (Micron). Larger particles can cause bronchitis, asthma, dermatitis to human beings.

Aerosols

Aerosols can be defined as solids or liquids are present in microscopic size in air. It can be dust, smoke, mists, fog and fumes. Sometimes they are called as Particulate matters it can be measured by using high volume air sampler. .

Dust

Dust is made up of Solid particles generated by crushing, grinding processes. Its range can vary from 0.01 µ to 100 µ (Micron). Mostly 5 µ or smaller particles tend to form stable suspension in air. It is called as particulate matter.

Learn More About Particulate Matter PM10 and PM2.5

Smoke

Smoke can be defied as particles produced by incomplete combustion of fuel. Generally size of the particles is less than 1 µ.

Mists

Mist can be defined as liquid particles are present in air in very low quantity. This means light dispersion of water droplets suspended in atmosphere.

fog\

Fog

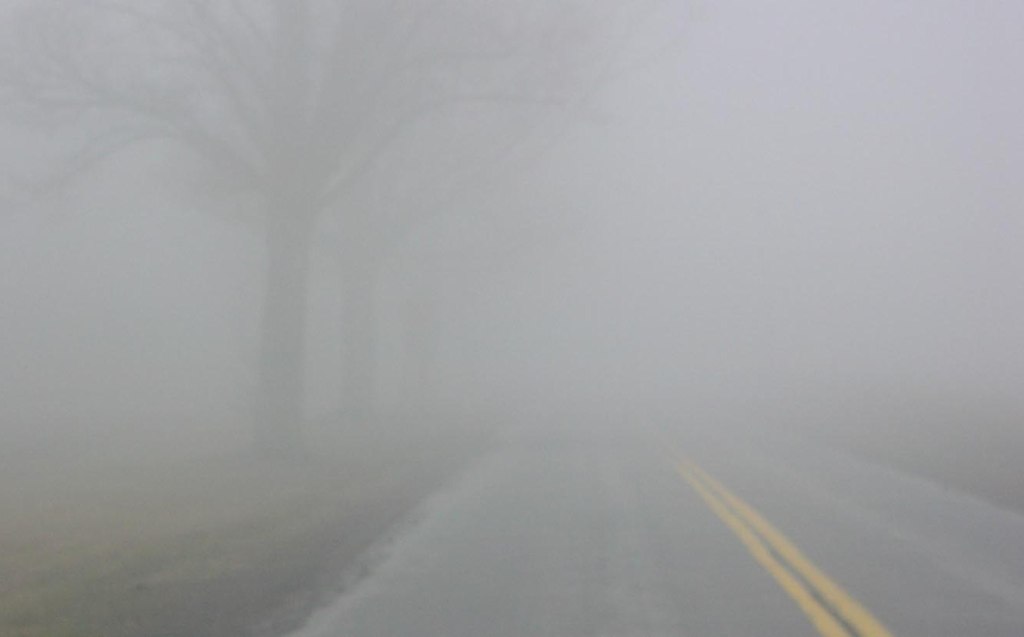
Fog is defined as visible aerosols present in air in liquid phase. Formation of fog is mostly because of condensation of water vapour. It can reduce visibility to less than 1/2 km. In Fog particle range can be vary from 40-1.0 µ

Fumes

These are solid particles produced by condensation from the gaseous state. Generally volatilization from melted substances. Fumes flocculate and sometimes coalesce.

 Gases

The various Gases and their vapours which are major contributor to air pollution.

Read More About

Sulphur Compounds

Sulphur Dioxide

Sources of air pollutants by Perfect Pollucon Services

This is one of the Primary pollutant of air pollutants. The main source of sulphur dioxide is combustion of fuels, especially coal. The sulphur content may vary from 1 % (good quality coal) to 4 % (bituminous coal). Another source of Sulphur is metallurgical operations. During smelting of ores of zinc, copper and lead produce sulphur dioxides.

Majorly SO2 is emitted from process stacks, DG set,  boiler stack, scrubber stack etc.

Learn more about How to Reduce Air pollution from Industries

Hydrogen Sulphide

This gas is foul smelling smell. The sources of this gas is majorly from anaerobic biological decay processes on land, in swamps and in oceans. Volcanos and Natural water springs emit hydrogen sulphide to some extent. Also Kraft pulp and Petroleum Refinary industry emit hydrogen sulphide to major extent.

Hydrogen Fluoride

Major Sources for hydrogen fluoride are manufacturers of phosphatic fertilizers, brick plants, pottery, aluminium industry and ferro-enamalworks. Hydrogen fluoride is very important air pollutant even if it is present in very low concentrations. And it can harm humans and animals at such low levels.

Chlorine and Hydrogen Chloride

Chlorine is found in polluted air as chlorine as hydrogen chloride, Chlorine containing organic compounds. Major Sources of Air Pollutants as chlorine and its compounds are chemical industries, water purification process, sewage plants, swimming pools etc. It can cause respiratory track irritation in human.

Oxides of Nitrogen

air pollution due to automobile

It is apparent that oxides of Nitrogen are the second highest contaminant in major cities. Mostly oxides of nitrogen are present due to emission from industries where nitric acid is produced or used. Next Sources of Air Pollutants as Oxides of nitrogen are Automobile exhausts, power plants and low heat burners and furnaces etc. out of all nitrogen oxides only nitric oxide and nitrogen dioxide arise from human activities. Normally it is written like NOx to show all oxides of nitrogen.

Learn more about How to Reduce Air Pollution from Cities

Carbon Monoxide

This is odourless and colourless gas produced by incomplete combustion of carbonaceous materials. It is highly poisonous gas. Major source of Carbon Monoxide is incomplete combustion of Fuel from automobiles engines. Also furnaces, petroleum refining operations, gas manufacturing plants etc. emit carbon monoxide.

Ozone

Origin of ozone in air has not been clarified but it is likely that sunlight and combustion are evolved in ozone’s production. Ozone is poisonous and smelly. It exists in upper layer of atmosphere.

Aldehydes

These are produced by combustion of Diesel, petrol fuel oil, natural gas, and gasoline etc. Incomplete combustion of fuels and lubrication oils cause to the formation of aldehydes. It can cause irritation of eyes.

Organic Vapours

Sources of Air pollutants like organic vapours include large numbers of chemical compounds, like aromatic hydrocarbons, acetylene, olefins and chlorinated hydrocarbons. It can be produced in combustion processes. Also they are majorly responsible for smog.

Radioactive Gases

A Major source of radioactive gases are nuclear power reactor. Also testing for atomic bombs, agricultural, industrial and medically use of radioactive isotopes etc.

Summarizing, major sources of air pollutants are mobile sources (Vehicles), stationary sources (Power plants, industries etc.), area sources (Agriculture, Cities etc.)

Effects of Air Pollution

Air pollution poses severe threats to human health, causing respiratory and cardiovascular diseases as a result of inhaling pollutants such as particulate matter and toxic gases. Additionally, it contributes to environmental degradation, harming ecosystems and biodiversity.
The impact extends to climate change, with pollutants like carbon dioxide and methane contributing to global warming. Finally, air pollution has economic repercussions, straining healthcare systems and reducing overall productivity.

Natural Sources of Air Pollutants

Natural sources of air pollution include volcanic eruptions, which release sulfur dioxide, ash, and other pollutants into the atmosphere, contributing to regional and even global air quality issues. Wildfires, another natural source, release large amounts of particulate matter, carbon monoxide, and volatile organic compounds, affecting both air quality and human health.
Additionally, dust storms, driven by natural weather patterns, can transport vast amounts of dust and particulates over long distances, impacting air quality in various regions.

Man-Made Sources of Air Pollutants

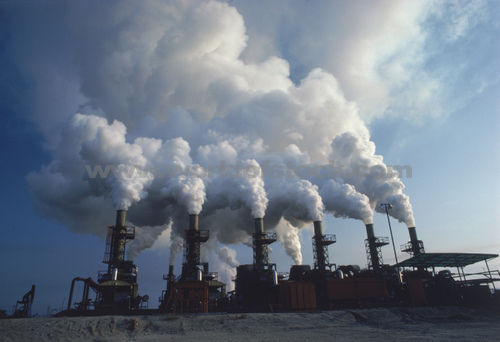
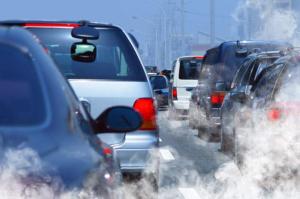
Man-made sources of air pollution encompass industrial activities, with factories emitting pollutants such as sulfur dioxide, nitrogen oxides, and particulate matter into the air. Transportation, particularly vehicles with internal combustion engines, releases significant amounts of carbon monoxide, nitrogen oxides, and volatile organic compounds, contributing to urban air quality issues.

Power plants burning fossil fuels further contribute to air pollution by releasing pollutants such as sulfur dioxide, nitrogen oxides, and greenhouse gases into the atmosphere.

What Worked in Indian Cities: Mini Case Studies

Pune – Waste Burning Controls & Patrols

Municipal patrols + citizen reporting + fines reduced open waste burning incidents. Impact: Noticed drop in localized evening PM2.5 spikes during winter.

PPS takeaway: Enforce rules + quick response teams + citizen WhatsApp lines work.

Surat – Industrial Stack Compliance Program

Targeted audits, maintenance of ESP/FGD and fuel quality checks for clustered industries. Impact: SO₂/NOx improved around the estate; fewer odor complaints.

How PPS conducts stack emission monitoring →

Punjab–Haryana – Stubble Burning Windows

Seasonal advisories + residue management pilots + satellite/ground surveillance. Impact: Episodic PM spikes can be forecast and partly mitigated with early communication.

Want results like these? PPS sets up monitoring plans, compliance roadmaps and reporting for industries & cities. Talk to an expert →

Sources of Air Pollutants in PDF

Source of Air Pollution by Perfect Pollucon Services in PDFDownload

Read more Environmental Monitoring

Methodology & Data Transparency

This explainer blends official datasets (e.g., CPCB/NCAP) with Perfect Pollucon’s 25+ years of field monitoring across Indian cities and industrial clusters. Source contributions shown above are indicative ranges; actual shares vary by location, wind patterns, fuel mix and season.

On low-cost sensors: Useful for hyperlocal trends; we apply calibration checks and acknowledge ±5–10% variability depending on model and environment. For regulatory decisions we rely on reference-grade instruments and accredited methods.

About Perfect Pollucon Services

Perfect Pollucon Services is an environmental monitoring expert in India since 2009, offering services in air, water, noise, and stack emission testing. With a network of trained professionals and NABL-accredited partners, PPS supports industries in achieving compliance with CPCB and State Pollution Control standards.


About the Author

Tanaji S. Gajare

Tanaji S. Gajare is the Founder & Chairman of Perfect Pollucon Services, one of India’s longest-standing environmental monitoring firms. With over 40 years of field expertise in Air Quality Monitoring, Stack Emission Testing, and Pollution Control strategies, he has personally supervised thousands of surveys across India’s industrial belts.

His mission is to simplify environmental compliance for industries while promoting sustainable practices that protect citizens’ health. Under his leadership, PPS has become a trusted partner for pollution source assessment, regulatory reporting, and environmental data transparency.

References

  • Central Pollution Control Board (CPCB) – Standards, reports & guidelines.
  • World Health Organization – Air Pollution.
  • MoEF&CC – National programmes & notifications.

Frequently Asked Questions

What are the 5 top sources of air pollution?

1.       Industrial Emissions: Manufacturing processes, power generation, and chemical production release pollutants into the air.
2.       Vehicle Emissions: Combustion of fossil fuels in cars, trucks, and motorcycles contributes to air pollution.
3.       Power Generation: Fossil fuel-based power plants emit pollutants during electricity production.
4.       Residential Heating and Cooking: Use of solid fuels like coal and wood for heating and cooking releases pollutants.
5.       Agricultural Activities: Livestock farming and crop burning are sources of air pollution.

What are the biggest sources of pollution?

The largest sources of pollution are often attributed to the combustion of fossil fuels in power plants, industrial activities, and transportation, releasing significant amounts of pollutants such as carbon dioxide, sulfur dioxide, and nitrogen oxides into the atmosphere.
Additionally, improper waste management, including open burning and landfill emissions, contributes substantially to air and environmental pollution.

What are the main causes of air pollution in Indian cities?

In urban India, the major causes are transport emissions, construction dust, open waste burning, and industrial activities near city limits.
During winters, temperature inversion traps pollutants close to the ground, causing smog and poor visibility.

What is the difference between natural and man-made sources of air pollutants?

Natural sources include volcanoes, sea salt spray, forest fires, and dust storms.
Man-made (anthropogenic) sources arise from human activities such as vehicular traffic, power plants, industrial operations, and household combustion.
Natural events are occasional, while human-caused pollution is continuous and controllable.

Which gases are major air pollutants?

Key gaseous pollutants include sulfur dioxide (SO₂), nitrogen oxides (NO and NO₂), carbon monoxide (CO), ozone (O₃), and volatile organic compounds (VOCs).
Each affects health differently — for instance, CO reduces oxygen transport in blood, while NO₂ irritates the respiratory system.

How can we reduce air pollution from industries?

Industries can:
Switch to cleaner fuels (PNG, LPG, low-sulfur coal).
Maintain electrostatic precipitators (ESP) and scrubbers for stack control.
Ensure continuous emission monitoring (CEMS).
Follow CPCB-prescribed limits and conduct third-party testing through accredited labs aggregators such as PPS.

How can individuals reduce air pollution?

Simple everyday actions matter – use public transport or carpooling, avoid open waste burning, conserve electricity, maintain vehicles regularly, and choose energy-efficient appliances.
Planting trees and supporting clean-fuel initiatives also help offset pollution.

What are the health effects of air pollution?

Exposure to polluted air can cause asthma, bronchitis, cardiovascular problems, and reduced lung function.
Long-term exposure increases risk of chronic respiratory diseases and premature mortality.
Children, elderly people, and those with pre-existing health conditions are most vulnerable.

What is the Air Quality Index (AQI)?

The AQI is a number that communicates how polluted the air currently is or how polluted it is forecast to become.
It converts complex air quality data (PM₂.₅, PM₁₀, NO₂, SO₂, CO, O₃) into an easy-to-understand scale ranging from Good (0–50) to Severe (400+).
India’s AQI is issued daily by CPCB for major cities.

What is the role of Perfect Pollucon Services in air quality management?

Perfect Pollucon Services provides end-to-end monitoring – from ambient and indoor air quality testing to stack emission and noise surveys.
Our 25+ years of experience help industries identify pollution sources, meet compliance standards, and implement preventive solutions.

Related Posts:

  • How to measure Indoor Air Quality - Perfect Pollucon Services
    How to Measure Indoor Air Quality?
  • Ambient Air Sampling - Grab sample - Perfect Pollucon Services
    Ambient Air Sampling Methods
  • Ambient Air quality Monitoring Service by Perfect Pollucon Services
    Ambient Air Quality Monitoring & Testing
  • ventilaton survey or air change survey by Perfect Pollucon Services
    Ventilation Survey
  • Best Air Purifiers for Home in India by Perfect Pollucon Services
    Best Air Purifiers for Home in India (2025) – Tested…
  • Air Quality monitoring
    Air Quality Monitoring & Testing
  • Indoor Air Quality Monitoring & testing
    Indoor Air Quality Monitoring & Testing
  • a modern home environment with an air quality monitor placed on a sleek wooden table. The monitor displays air quality monitor by Perfect Pollucon Services
    Best Air Quality Monitors in India 2025 | Expert Reviews
  • Home Air purifier - Perfect Pollucon Services
    Air Purifier for Home & Its Benefits
  • professional air quality testing - perfect pollucon services
    Professional Air Quality Testing
  • effects of poor ventilation - Perfect Pollucon Services
    Effects of Poor Ventilation
  • Continuous Ambient Air Quality Monitoring Systems (CAAQMS) by Perfect Pollucon Services
    Continuous Ambient Air Quality Monitoring System (CAAQMS)

Post navigation

Effects of Fireworks in Diwali
Benefits of Environmental Monitoring

0 / 180

Environmental Monitoring Services

  • Ambient Air Quality Monitoring & Testing
  • Indoor Air Quality Monitoring & Testing
  • Air Quality Monitoring & Testing
  • Fugitive Emission Monitoring & Testing
  • Stack Emission Monitoring & Testing
  • Food Testing Laboratory Services
  • Noise Level Monitoring & Testing
  • Corrosion Testing Services
  • Ventilation Survey
  • Illumination Survey

Search

Download Our Brochure (682 kb)

Download Our Company Brochure

WhatsApp Chat with Perfect Pollucon Expert

Recent Posts

  • Dehumidifier Maintenance & Cleaning Tips for Indian Homes | Expert Guide by PPS
  • Understanding Ideal TDS, Hardness & Microbial Load in Water
  • Dehumidifier vs Air Purifier vs Humidifier: Expert Indian Guide
  • IAQ Testing for LEED & WELL Building | PPS Expert Guide
  • EC Compliance Report 2025 – Expert PPS Guide
  • RO vs UV vs UF Water Purifier: Which is Better in India?
  • Best Water Purifiers for Home in India (2025) – Lab Tested Reviews
  • How to Fill E-Waste Form 3 Annual Return (Step-by-Step)
  • SPCB Environmental Compliance Forms – The Ultimate Guide
  • How to Fill Form 10 Hazardous Waste Manifest -Step-by-Step Guide

Environmental Consultancy Services

  • Environmental Monitoring and Assessment
  • Environmental Impact Assessment
  • Effluent Treatment Plant
  • Effluent Treatment Plant Design
  • Consent to Establish, Consent to Operate and Renewal
  • Six Monthly EC Compliance Report
  • Self Audit Report MPCB
  • Environmental Compliance in India
  • Ventilation Survey
  • Tools
  • HTML Sitemap

Environmental Monitoring Services

  • Ambient Air Quality Monitoring & Testing
  • Indoor Air Quality Monitoring & Testing
  • Air Quality Monitoring & Testing
  • Fugitive Emission Monitoring & Testing
  • Stack Emission Monitoring & Testing
  • Food Testing Laboratory Services
  • Noise Level Monitoring & Testing
  • Corrosion Testing Services
  • Ventilation Survey
  • Illumination Survey

About Us

  • Home
  • Blog
  • Our Vision & Mission
  • About Us
  • Case Studies
  • Industries We Serve
  • Write for Us | Guest Posting
  • Privacy Policy
  • Terms and Conditions
  • Explore our EnviroTech platform: EHSSaral.com

Registered Office

Perfect Pollucon Services – Environmental Consultancy Company
3 Krishna Koyna B, Majiwada Thane,
Maharashtra, India
400601
Email: [email protected]
Phone :
+91 9137 039 315
+91 9930 180 059
+91 7045 651 859
Perfect Pollucon Services (proprietorship firm reg. 2009) is now Perfect Pollucon LLP (CIN : ACP-2349) (reg in Jun’2025)

  • Privacy Policy
  • Terms and Conditions
  • Contact Our Experts
  • Sitemap
@Copyright Perfect Pollucon Services
Sources of Air Pollutants